Aerospace & Defense (A&D) Contractors
Capturing Value Creation Among Prime A&D Contractors through VBM - Value Based Management ™ and Economic Value Added (EVA®)


Aerospace & Defense (A&D) Contractors
7/28/2020
Executive Summary
Prime Aerospace & Defense (A&D) Contractors
- Prime A&D contractors have EBITDA margins half those of similar, blue chip industrial manufacturing industries
- Despite lower EBITDA margins, prime A&D contractors have traded at significant premiums to book value. Double digit EVA spreads and longer competitive advantage periods, originating primarily from higher entry barriers, drive the prime A&D contractors’ relatively high valuation
- Incorporating EVA will optimize contract pricing and will allow value sharing between prime A&D contractors and the US taxpayer
- GOCO type vehicles and R&D payments by the government are not appropriately reflected when measuring the performance of A&D firms and should be given special consideration
Introduction
EVA Analysis Shows Room for Improvement in Government Cost Saving Efforts
EVA® (Economic Value Added) lies at the core of VBM - Value Based Management™ and represents a company’s true economic profit. Our analysis of EVA among the nine most important companies contracting with the government in the A&D industry shows that these companies generate significant operational shareholder value as measured through EVA, despite having what could be considered tight profitability margins in their government contracts.
The government, through its contracts, lowers the cost of capital for prime A&D contractors, contributing to their high EVA spreads.Therefore, traditional measures of profitability, such as EBITDA, obscure the positive impact on profitability that government contracts provide on the capital side of the equation. This indicates an opportunity for the government to incorporate EVA in contract pricing and decision-making, thus ensuring optimized pricing that balances value creation opportunities for contractors while concurrently affording cost savings for government contracting bodies and the American taxpayer.
Prime A&D Contractor Performance
Prime A&D Contractor Peer Set and Goodwill Adjustments
Our study looked at nine of the prime A&D contractors for the Department of the Defense: Lockheed Martin, Raytheon, Northrop Grumman, General Dyamics, Huntington Ingalls, Leidos, L3, SAIC, and the defense portion of Boeing. We performed analysis, including and excluding goodwill, as goodwill carries a capital charge that is not part of a firm’s contract with the government.
EBITDA Margins
Avg. EBITDA Margins Prime A&D Contractors vs BCIMs (2016 – Jun. 2020 LTM)
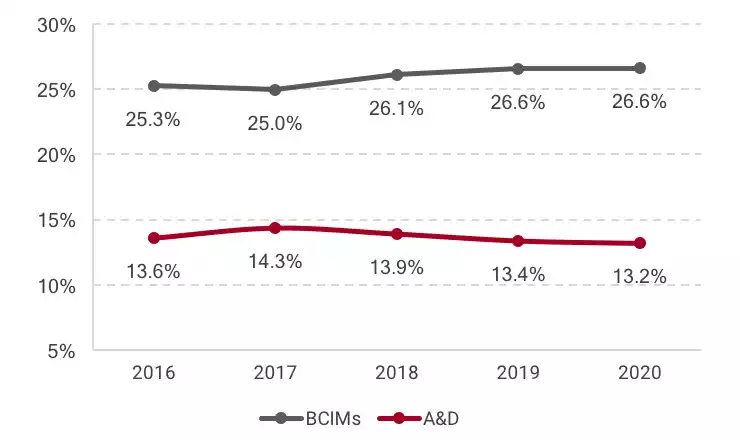
Compared to peers in similar, blue chip industrial manufacuring industries (BCIM), prime A&D contractors show weaker EBITDA margins, with margins approximately half those of peers (26% vs. 13% in 2019, respectively). These significantly weaker EBITDA margins indicate operational inefficiencies compared to peers, some of which may be explained by the strict regulatory and documentation standards required by complex government contracts and the traditional “cost +” approach to contracts.
Trading at a Premium
Yet, despite these significantly lower margins, prime A&D contractors have traded at a significant premium to book value, comparing favorably to BCIM peers.
“EVA performance and long competitive advantage periods drive valuation premiums”
Avg. Prime A&D Contractors MVA/EV (2016 – Jun. 2020 LTM)
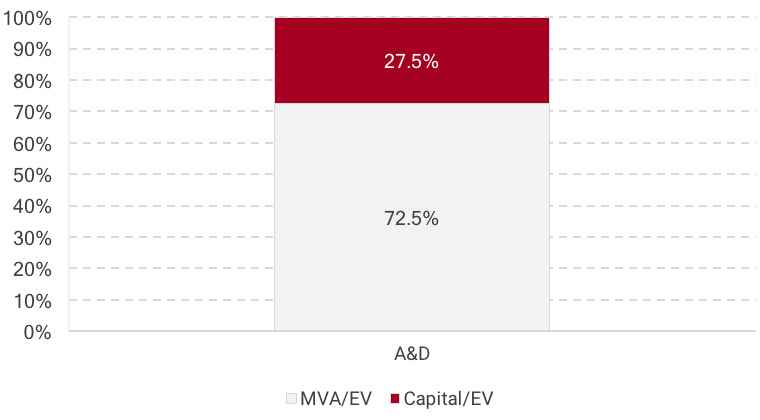
Our research shows that these valuation premiums have two distinct drivers: a prime A&D contractor’s EVA performance, as well as the long competitive advantage period these prime A&D contractors enjoy from the investor’s perspective.
Double Digit EVA Spreads
EVA is true shareholder value generated by a company. It equals the operating profit after tax minus a rental charge on all capital employed, debt and equity. A positive EVA indicates, in absolute terms, that a firm paid back the cost of the capital and then created surplus profit for shareholders. Conversely, a negative EVA, in absolute terms, means that a company did not recoup the cost of the capital it has used.
To calculate EVA, we make certain adjustments to accounting statements to more accurately reflect operating performance for companies, such as adding R&D or operating leases back into capital.
The EVA spread measures the difference between a firm’s Return on Invested Capital (ROIC) and its Cost of Capital (CoC), debt and equity.
“Prime A&D contractors consistently return a double digit, positive EVA spread, indicating significant value creation for shareholders”
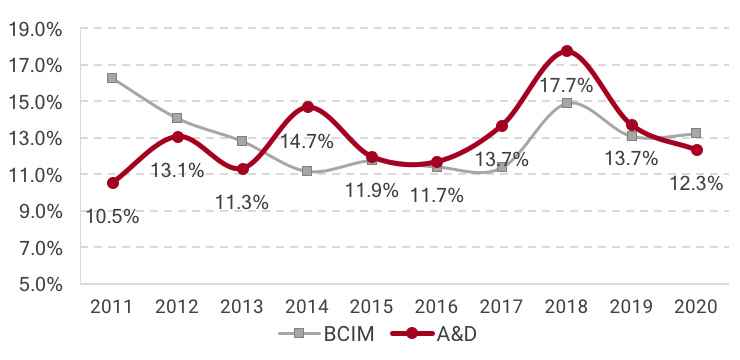
Prime A&D contractors have consistently created significant operational shareholder value, as measured by EVA excluding goodwill. In fact, prime A&D contractors have seen double digit EVA spreads over the last 10 years. This performance has been mostly higher than BCIM peers since 2014 despite A&D firms having significantly lower EBITDA margins.
Avg. Prime A&D vs. BCIM Contractors’ EVA Spread (2011– Jun. 2020 LTM)
Currently, the government and prime A&D contractors focus on margins and EBITDA, which does not give an indication of the prime A&D contractors’ true performance.
Contrastingly, we focus on operating profits and the costs and returns on capital. This reflects the true economic performance of the prime A&D contractors.
Furthermore, as government contracts reimburse all or most of a project’s capital employed, shareholder equity is encumbered for significanlty less time and is quickly replenished with capital from a low-risk source that will always pay the bill, i.e. the federal government.
“Government capital unencumbers shareholder equity, lowers the cost of equity, and leads to lower costs of capital”
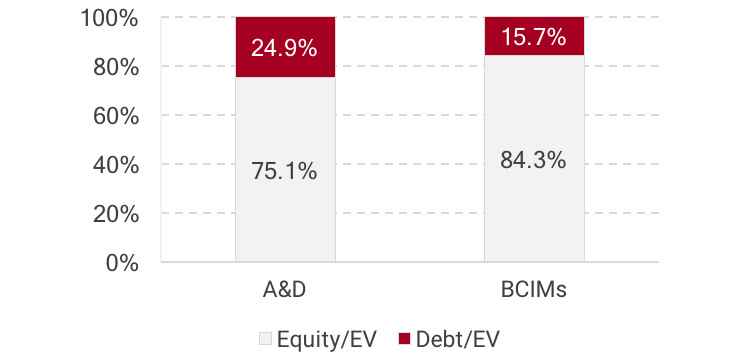
This enables prime A&D contractors to have over 1.5X the leverage of comparable BCIM firms, while keeping the cost of capital at similar levels.
Avg. Debt/EV Prime A&D Contractors vs BCIMs (2016 - Jun. 2020 LTM)
Longer Competitive Advantage Periods (CAP)
A longer competitive advantage period means that a firm is able to enjoy positive returns for a longer period of time. This in turn translates into higher valuations, as illustrated in the graph below.
How the Competitive Advantage Period Impacts Valuations
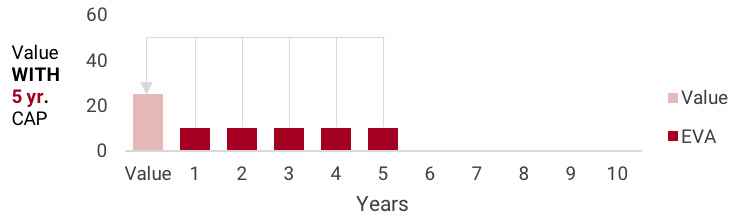
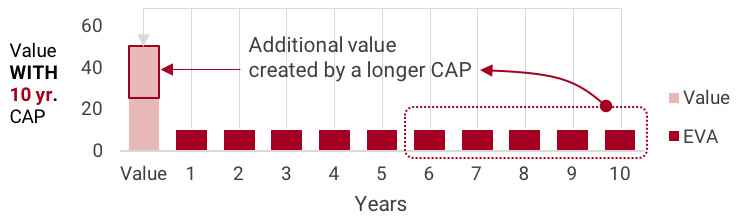
In the case of prime A&D contractors, this longer comparative advantage period stems from high barriers to entry into the industry. Advanced and complex machinery, specialized and skilled labor, and licensing requirements make the industry highly concentrated and discourage potential new competitors from entering the market. While some emerging competition has been seen at the peripheries of the industry, it has yet to threaten the prime A&D contractors in any significant way.
EVA is Key for Stress Testing and Optimized Contract Pricing
Current government contract terms lead to tight profitability margins. However, by focusing solely on traditional metrics such as EBITDA, the government is overlooking the second half of the equation, i.e. capital
By ignoring value-focused metrics, such as EVA, the government is not looking at the costs and returns on capital used by the prime A&D contractors. EVA accomplishes this by shedding a light into a firm’s ability to cover necessary expenses and capital costs. In addition, by incorporating the cost of capital, EVA factors in the level of potential risk for shareholders, debtholders, and in this particular case, the American taxpayer.
“Cost +” does not encourage cost or capital management, making A&D firms more like public utilities, or even state owned enterprises. But in moving to a value sharing approach where the government and A&D firms share the value created, efficiency and innovation are rewarded. That should mean higher share prices and more value for the American taxpayer.
As a new stimulus bill makes its way through the legislature, it is imperative to ensure the biggest bang for the buck for the defense supply chain and the American people, while simultaneously maintaining equitable and value creating contract terms for prime A&D contractors. EVA and VBM - Value Based Management™ will prove indispensable in assessing the true levels of profitability that government contracts bring to contractors and allow for evidence-based, prudent, and optimized contract pricing.
Additional Considerations
Adjusting Performance Measurement to Reflect Unique Conditions
Some government contracts are subject to unique circumstances which affect the way we should approach, understand, and calculate performance measurement for contractors.
There are two ways to view the performance measurement of A&D contractors: the company view (by their equity and debt investors) and the DoD perspective (by taxpayers). This is especially relevant for those firms that benefit from Government Owned Contractor Operated (GOCO) arrangements and Research & Development reimbursements (R&D).
Three Lenses Through Which to Analyze EVA Performance
VA is the most important and comprehensive financial measure of profitability and value creation. When we measure a company’s EVA, we make certain adjustments to the accounting statements in order to more accurately reflect the true economic reality of the company. In the case of prime A&D contractors, this would mean making adjustments to the financial statements to reflect more accurately the source, funding, and use of capital in GOCO arrangements and reimbursements of R&D spending. Below are three levels of EVA analysis that we could perform on prime A&D contractors (in ascending order of robustness and accuracy):
- Typical EVA measurement for prime A&D contractors. This measurement shows the as-is, unadjusted for government capital performance of a prime A&D contractor. In other words, with this approach, we do not take government investments into account and only calculate the value created from the capital a company has actually invested itself.
- EVA measurement adjusted and “charging” for GOCO and R&D. This EVA measurement charges the government capital invested into the prime A&D contract, thus creating a cost for this government capital and treating it analogously to how we normally charge for debt and equity capital.
- EVA measurement counterfactual, simulating the effects on profitability if a prime A&D contractor were forced to provide the entirety of the GOCO and R&D capital that a government contract is currently providing. In other words, this measurement shows the following “what-if scenario”: how much value could a prime A&D contractor expect to create in the same situation if it were instead a completely private, non-government capital supported company? Additional factors to consider when not using GOCO facilities are ramp-up time, know-how, fees for idle facilities, etc.
Appendix
Blue Chip Industrial Manufacturing Peers (BCIMs)
- 3M Co
- Honeywell International
- Roper Technologies
- Danaher Corporation
- Rockwell Automation
Glossary and Definitions
EVA® - Economic Value Added, a measurement of economic profitability whose use and implementation in the corporate world was pioneered by SVM.
There are two equivalent equations for calculating EVA:
- NOPAT- (CoC * Capital)
- (ROIC – CoC) x Capital
Value Based Management - A system of management and way of corporate thinking which centers on creating shareholder value, empowering employees by making them co-owners of the firm through incentive compensation, and ensuring that decisionmakers are held accountable for their deployment of precious limited capital.
Cost of Capital (CoC) - The combined costs of debt and costs of equity, weighted for their relative usage within a company. Represents the minimal return needed to create any economic profit.
EVA Adjustments - Since the accounting conventions do not necessarily reflect the economic reality of the business, the EVA adjustments are adaptations to the financial accounting statements that allow the creation of a performance measure linked to the creation of value.
Capital Charge - How much the capital that a company employs costs. Found by multiplying the cost of capital by the amount of capital employed.
EBITDA - Earnings Before Interest, Taxes, Depreciation, and Amortization. A commonly used performance metric. Its big weakness is that it does not account for the cost of capital.
Goodwill - The excess of the purchase consideration over the net value of assets minus liabilities.
ROIC - Return on Invested Capital. A company must return more on its invested capital than the cost of the capital in order to be profitable.
Cost of Equity - How much shareholders expect in returns; how much a firm would theoretically pay its shareholders to compensate for the risk in investing in the company.
MVA - Market Value Added. The amount of Enterprise Value which is not attributable to the company’s capital. Shows how well a company has added value from available capital.