
Capital Allocation: Tangible vs. Intangible Assets
7/21/2020
It is vital that firms invest their capital in the most effective way, a way that will lead to real value creation providing a return higher than the cost of capital. Therefore, capital allocation is the primary role of the chief executive of any firm. Most firms will perform analysis of capital investments, some may even track how these investments perform over time, and true best-in-class firms will link capital investment outcomes to incentive compensation. But when trying to assess the efficiency of investments in intangible assets, few companies—even those considered to be best-in-class—spend the time and the effort needed.
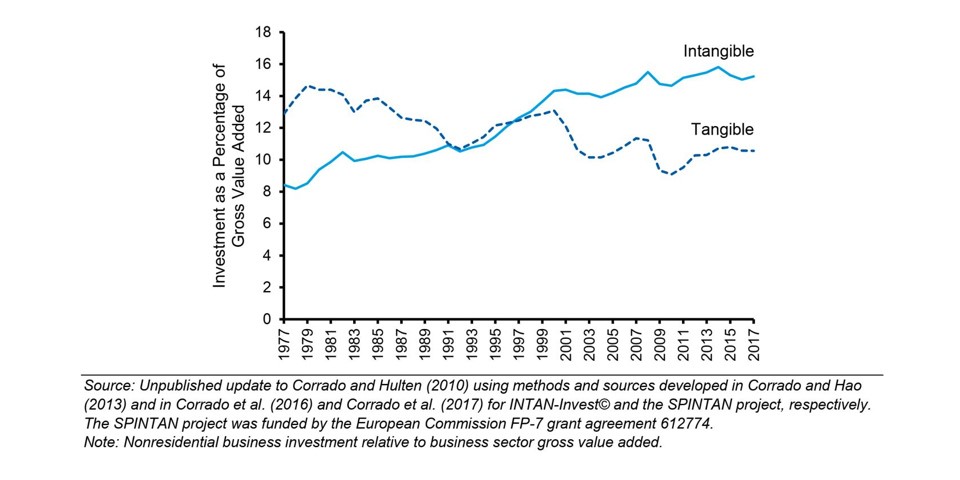
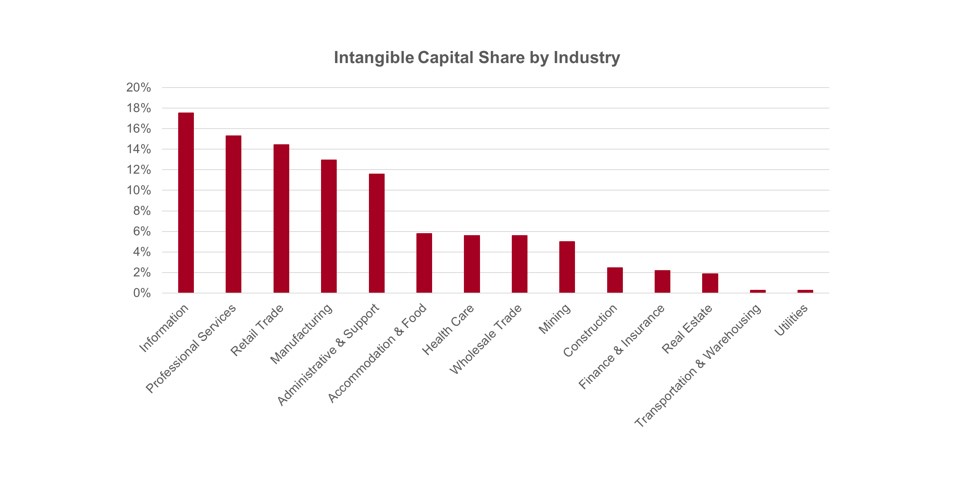
Yet investments in intangible assets have grown significantly over the last four decades (see Graph 1 below) and so cannot be ignored—especially in industries where a significant percentage of investments are of the intangible sort (see Graph 2 below). Therefore, the same rigorous process expected for tangible capital investments should be a feature of intangible investment analysis.
Graph 1: Intangible vs. Tangible Investments
Graph 2: Intangible vs. Tangible Capital Share by Industry
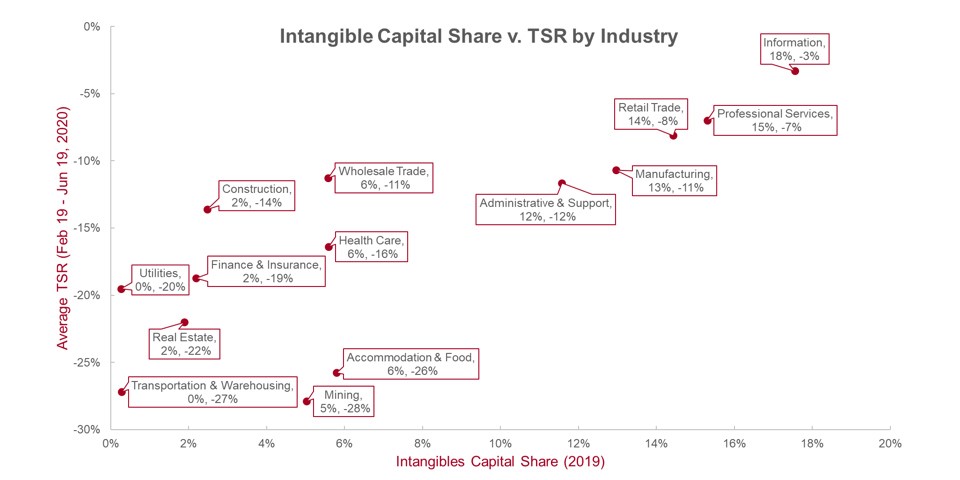
Our analysis of the relationship between intangible investments and Total Shareholder Return (TSR) shows that industries with higher investments in intangibles1 have better weathered the recent decline. In fact, the relationship shown in Graph 3 below is significant with a correlation of 0.79.
Graph 3: Intangible Capital Share vs. TSR by Industry
Some of the repercussions of the recent uncertainty may last well into the future. That could mean fewer investments in physical offices, campuses, and plants, and more in virtual space as well as in the software, processes, training, and IP involved in making this run smoothly.
This could potentially be negative, especially for those firms that will decide to invest in solutions without regard to how well those solutions fit their needs. As an example, think of those companies that push Slack, Zoom, Webex, and Microsoft Teams on their employees without considering the significant overlap that exists between all of these products.
But there is significant positive potential as well. Firms that evaluate intangible investments in the same way they evaluate tangible investments will be more productive and create more value for shareholders. Firms in industries that are not known for significant investments in intangibles should increase their investments in these categories and potentially set themselves apart from their peers.
If these investments are properly evaluated and if their outcome is linked to senior management’s variable compensation, they could experience returns that are significantly higher than those of their peers. This is significant not only in tough times, as those experienced in recent months, but also in good times.
1
Intangible Capital
Intangible Capital Share = ——————————————————————— ----------------------
Total Capital
Intangible Assets + Capitalized Expenses
= -----------------------------------------------------------
Total Assets - Current Liabilities + Capitalized Expenses
Intangible Assets exclude goodwill and only take the change between 2014 and 2019.
Capitalized Expenses include R&D, marketing and advertising expenses which are capitalized and then amortized in five years.