
Financial Policy: What is the Optimal Capital Structure and Why Does The Debt Level Vary Among Industries?
4/24/2013
The objective of firm value maximization is at the heart of corporate financial theory. A company can create value through its operating, investment, and financing decisions. From the financing perspective, a firm can maximize its value by achieving the optimal mix of borrowed capital (debt) and equity; in effect, this optimal balance minimizes the firm’s weighted average cost of capital (WACC).
There are a number of benefits to using debt, which include: 1) generating the tax benefits of interest expense; 2) reducing agency cost, by mitigating overinvestment and underinvestment risk; and 3) sending a positive signal to the market regarding expected future results.
On the other hand, a high level of debt increases the probability that a firm will face financial difficulties (financial distress) and / or refuse projects that would create value due to a lack of financial flexibility.
In general, financial policy should be aligned – by means of an appropriate level of flexibility – with a company’s business strategy. To develop a financial policy, a company should analyze its future cash requirements to set an appropriate level of indebtedness. Cash needs should be linked to capital requirement and acquisition plans and should be determined in the context of the company’s business environment. As a consequence, an adequate level of financial flexibility will be necessary to match the projected cash flows and corporate strategy of the firm.
Based on these arguments, financial policy varies from company to company since different firms have different economic realities. This argument is strengthened by a study that was conducted by Stern Value Management. This study, which analyzed U.S. stock market-listed companies with market values of over $1 billion, shows great variation in financial leverage – defined as total debt divided by total capital – among the observed companies.
From the initial sample, some distinct business sectors were selected: heavy industry, retail, and utilities. This segregation enables a clear understanding of the drivers that influence a company’s decision on its optimal leverage level.
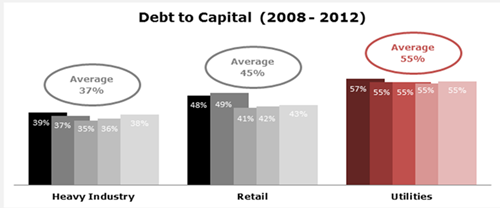
Chart 1: Leverage Comparison in different sectors in United States
The heavy industry shows an average of 37% leverage. Companies include large commodities players and equipment producers. In this sector, the volatility of cash flows is high, so the additional tax benefit from the use of more debt may not be sufficient to compensate for the risk of insolvency.
On the other hand, the retail sector shows an average of 45% leverage. This sector is characterized by lower operating margins, partially as a result of an asset-light business model (which includes the heavy use of outsourcing) and high fixed costs. But the soundness of sales and receivables reduces risk, thus allowing access to better credit instruments.
The utilities group usually has a high operating margin and strong cash generation with low variability, which allows for the most leverage – an average of 55% – among the highlighted sectors. As a result, utilities companies can borrow at a lower cost and for longer terms. From the capital structure point of view, we see that the business model of utilities players supports their heavy use of borrowed funds.
Nevertheless, the target capital structure of each company may have particular characteristics that may not necessarily be related to the sector in which the firm operates. Consequently, a pure comparison with peers is not enough to evaluate whether a capital structure is optimal.
In fact, many studies show that U.S. firms are levered at a lower level than their optimal potential. The definition of appropriate capital structure should be based on a complete framework that simulates all the costs and benefits and contemplates the company’s business plan, considering future investment opportunities, tax plans, minimum operating cash, investment schedules, and the costs of financial distress, among other variables.
Only a few companies take into account the variability of projected cash flows when setting their financial strategies. Most firms use a more traditional approach based on static business models that ignore possible market fluctuations and do not consider the risk of projected cash flows. Therefore, financial policies defined by using this approach become highly vulnerable to the occurrence of unplanned events.
One important question does come up: how is uncertainty incorporated into cash flow projections? One way to incorporate uncertainty is to use a scenario analysis built on a combination of factors. Another method, known as dynamic analysis, simulates hundreds or thousands of scenarios and produces a range of projected cash flows. The result is not a number, but a statistical distribution in which risk is measured by the variability of the cash flows. Two applications of this analysis allow us to measure the likelihood of a company achieving a predetermined level of debt coverage, and estimate the minimum operating cash that would reduce the risk of a company not meeting its schedule of planned dividends. Hence, it is possible to obtain crucial information on cash flow and important P&L and balance sheet variables to better understand a company’s situation and design a financial policy structure.
Dynamic models are a financial planning tool that supports decision making and allows us to better understand the volatility of the different variables that impact a business. Companies can use this tool to define the best financial flexibility when deciding on the optimal mix of debt and equity in their capital structure. As we said in the beginning, the unifying objective of all corporate policies is to maximize the value of the business, and the optimal financing mix leads firms towards achieving that goal.