
Leverage by Industry in Times of Uncertainty
7/13/2020
Firms are learning the hard way that a rise in leverage brings with it an increase in the risk of financial distress, especially in times of uncertainty. This is not only true for firms with high financial leverage, or high debt, but also for firms with a high proportion of operational leverage, which means a high share of fixed costs.
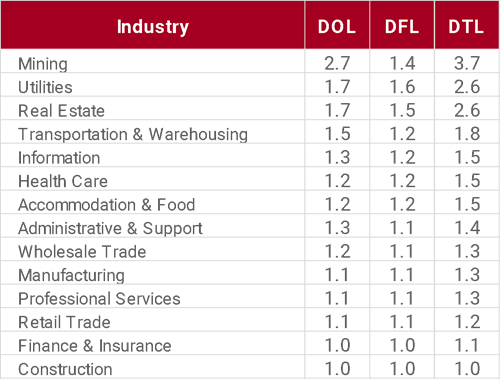
Industries like Mining, Utilities, and Real Estate have both the highest operating and financial leverages (see table below). In good times these industries can benefit more from each additional sale as their fixed costs are diluted by the increase in revenue. In bad times, however, they carry more fixed costs for lower revenues, directly impacting their earnings.
Table 1: Leverage by Industry¹
To understand the impact leverage has on shareholder value over the crisis period from February 19 to June 19, 2020 we analyzed each industry’s return and compared it to the various types of leverage. Operating, Financial, and Total Leverage are all negatively correlated with TSR at -0.58, -0.51 and -0.60, respectively. In other words, the higher the leverage, the greater the fall in TSR.
Graph 1: Degree of Total Leverage vs TSR by Industry
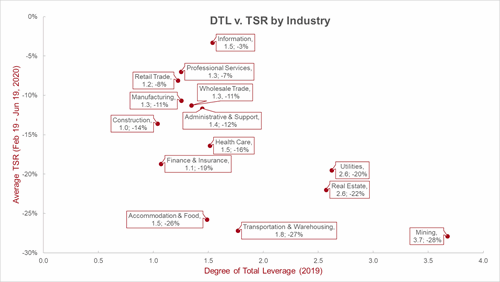
Consistent with conventional wisdom, the high fixed costs of depreciation and amortization as well as interest expenses are seen as threats to the company once sales decrease and economic activity is likely to remain sluggish for the foreseeable future.
The recent uncertainty brought great challenges to companies and society as a whole. In order to keep the virus from further spreading, people were asked to stay at home and non-essential businesses were temporarily shut down. Businesses with lower financial and operational leverage were able to adjust faster, reallocating resources to fulfill their most immediate needs. Firms with higher leverage were forced to evaluate multiple competing claims from debt providers, landlords, and other fixed costs.
Our findings highlight the importance of proactively identifying the appropriate degree of total leverage. This is especially true for those firms in industries that are traditionally reluctant or find it “impossible” to reduce their exposure to debt and fixed costs and tend to over extend themselves.
These firms should start by identifying their optimal capital structure (mix of debt and equity) through stress testing and scenario analysis. Debt has a role to play in a firm’s financing decisions, but understanding how much debt is appropriate given the firm’s current and future plans must be part of every firm’s planning exercise.
A similar analysis must be performed for operating leverage. Identifying the critical fixed costs that can be converted into variables should be part of the firm’s annual planning exercise. What is the cost/benefit of going virtual? Can some of our equipment/facilities be leased instead of bought? Can we shift more employee compensation to be variable instead of fixed? What non-strategic activities can be outsourced?
Companies in industries with traditional high leverage, that focus on creatively finding alternatives to reduce both financial and operating leverage, will weather this and future crises better than their peers.
________________
¹
Degree of Operating Leverage (DOL)=EBIT+Depreciation & AmortizationEBIT
Due to lack of data on other fixed costs, only Depreciation & Amortization is included for the calculation of DOL
Degree of Financial Leverage (DFL)=EBITEBIT-Interest Expense
Degree of Total Leverage DTL=DOL*DFL