Measuring Performance in Oil & Gas
Drivers of value are different in Oil & Gas than in other industries. Traditional accounting measures do not properly reflect the value-creation potential of an integrated Oil & Gas company


Measuring Performance in Oil & Gas
7/18/2021
Executive Summary
- Traditional performance metrics such as EBITDA, Net Income or Return on Invested Capital (ROIC) do not appropriately appraise an integrated Oil & Gas (O&G) firm’s performance.
- Even traditional Economic Value Added (EVA®), which is an excellent metric for most capital-intensive industries, falls short of fully assessing an integrated O&G firm’s performance as it does not take into account the value of reserves.
- To solve this problem, we need to incorporate the value of a firm’s reserves and the capital spent discovering and managing these reserves to an EVA calculation.
- A study of the 5 largest integrated O&G firms finds a high correlation between an EVA measure of performance that incorporates reserve valuation and the firms’ Total Shareholder Return (TSR).
Introduction
What Creates Shareholder Value in O&G?
Over twenty years ago we performed various studies to understand what drives shareholder value for integrated O&G firms. At that time, we identified reserve management as being the most important aspect. Yet, since then, the O&G industry has seen significant changes. The two that standout the most are the significant increase in shale exploration and the more recent push by groups of investors for increased focus on ESG standards and indicators. These two developments made us contemplate the possibility that reserve management may not be as important as it used to be, so we set out to study this issue once again.
In this study we do not look at whether ESG adherence is linked to shareholder value. Instead, we look to see if reserves are still an important driver of valuation. For that, we start by discussing the drawbacks of traditional performance metrics. We then discuss a performance metric that does include reserve value as a key driver, and as a last step we analyze how well the various metrics correlate to shareholder value.
Introduction to Performance Measurement in O&G
Traditional measures of profitability, such as EBITDA and Net Income, are misleading and incomplete, as they do not take into account the cost of capital. EVA, on the other hand, does include the cost of capital in addition to allowing for making adjustments to the financial statements in order to reflect the economic reality of a business (e.g., treating R&D as an investment and not an expense). But that is still not enough to correctly account for all relevant performance elements of an integrated O&G company.
In fact, “The application of EVA in the oil patch—one of the most important, complex, and capital-intensive industries in the world—has lagged behind that in most other industries. It has lagged because the accounting information gathered and reported by oil and gas concerns does a distressingly poor job of conveying the true economic results of those firms in a timely and meaningful way. As a result, all accounting-based measures, including a measure such as EVA that is derived from accounting information, have been ineffectual as meaningful goals, as decision tools, and as compensation benchmarks” (McCormack & Vytheeswaran, 1998).
The purpose of this article is to illustrate and discuss the most common flaws of assessing performance for integrated O&G firms by using accounting statements, and to present an improved, industry-specific definition of EVA that is practical, accurately reflects performance, and guides better decision making among industry leaders.
Traditional EVA Measurement
EVA is calculated by deducting a capital charge from a firm’s Net Operating Profit After Tax (NOPAT). The capital charge is in effect a rental charge for the use of the capital employed in the firm and is calculated by applying a weighted average cost of capital (WACC) to the capital provided by debt and equity holders.

Because accounting statements are conservative in nature, and their original purpose was to provide a picture of the financial health of the firm, it may be appropriate to make certain adjustments to reflect the real economic performance of a business. Some of the most common adjustments deal with the reclassification of certain items that were labeled as “expenses” by accounting, when in reality they should be considered as “investments,” and therefore should be reflected in a firm’s capital. Examples of this are Research & Development or investments in Human Capital.
In addition, when it comes specifically to integrated O&vG firms, some of the most important adjustments are:
- Exploration Expenses: Costs of drilling dry wells (those that are not economically viable) are reflected as expenses in the Profit & Loss statement (P&L), when in reality they should be considered investments in exploration efforts and should be capitalized.
- Assets Impairments/Write Downs: Assets that have seen changes to their book value due to higher or lower accounting value can result in a misstatement of a firm’s true capital employed. In order to appropriately measure the return to shareholders, those impairments or write downs should be added back to capital and should not have an impact on a firm’s NOPAT.
- Gain/(Loss) on Sale of Assets: After selling an asset, the difference between the sale price and the book value is accounted as a gain or loss in the P&L. However, as this gain or loss is not operational in nature, it should be reflected in a firm’s capital as a reduction (in case of a gain) or an increase (in case of a loss) to the capital base, and not accounted as an operational profit or loss.
“The mission to increase EVA encourages managers to add value in four ways: (1) to cut costs and raise profits but without raising capital; (2) to invest capital and grow the business but only through positive net present value (“NPV”) projects; (3) to withdraw capital from non-productive uses and return it to investors; and (4) to reduce the cost of capital through financial strategy and investor communications. No other measure and no other mission sends so many important messages so clearly and so succinctly to the operating people in a firm” (McCormack & Vytheeswaran, 1998).
EVA was described by the late management thought leader Peter Drucker as the most complete performance metric as it covers all factors of production. Unfortunately, Drucker was wrong when it comes to the O&G industry, as traditional EVA fails to incorporate the value created by the Exploration & Production (E&P) arm of an integrated O&G firm. It is with that in mind that we have created an improved measure of value for the O&G industry, a measure that incorporates the added value created by E&P through reserve management.
EVA for Integrated Oil & Gas Companies
We can look at integrated O&G firms as having two main levers of value creation: operational efficiency and reserve management. The operational efficiency lever can be assessed by traditional EVA as it appropriately reflects the value created from the day-to-day operations of most O&G areas, as well as the performance of these areas’ long-term investments. Yet the performance of E&P, which in the case of the super majors tends to be the largest area, is not fully captured by this lever, as it does not take into account the area’s most important task: managing the firm’s O&G reserves.
To address this, we must look beyond the accounting statements and focus our attention on a firm’s reserve disclosure. This disclosure is provided in a firm’s 10-K or 20-F filling with the Securities and Exchange Commission (SEC) where the firm’s reserves are valued by using a Net Present Value (NPV) approach. While this disclosure is not comprehensive (e.g., it only mandates firms to report their most likely, proven reserves also known as 1P and not their probable and possible reserves), the change in this reserve value from one year to the next gives excellent insight into the E&P area reserve management capabilities.
Therefore, to improve our EVA measurement of an integrated O&G firm, “The period-to-period increase in the NPV of the company’s reserves should be added both to its NOPAT and to its capital, in effect marking the reserves to market value. By adding the estimated increase in NPV to the assets as well as to the earnings, we both preserve the integrity of double-entry bookkeeping and maintain the equivalence between EVA and cash flow valuations. That much is necessary to ensure that the new oil and gas EVA measure has all of the attractive attributes of the classic EVA calculation” (McCormack & Vytheeswaran, 1998). (McCormack & Vytheeswaran, 1998)
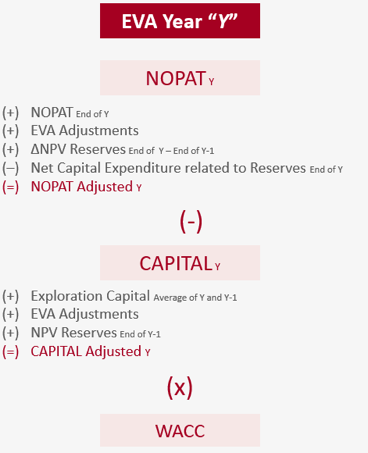
NOPAT Reserves Adjustment
The NOPAT adjustment involves adding the change in the valuation of the reserves (Δ Reserves Valuation) and subtracting the Net Capital Expenditure related to those reserves. By doing this, we not only consider how much the value of the reserves have increased or decreased in this period but also the period’s costs of managing current reserves and exploring for new ones.

If we spent more than what we discovered in new reserves, this will contribute negatively to NOPAT, while the opposite is true if we discovered reserves whose value is higher than the cost of discovering them.
Capital Reserves Adjustment
To ensure the E&P side of the O&G company is creating value, we must not only take into consideration the capital associated with exploration efforts but also the initial value of the reserves.
This way, value is only created if the change in the value of the reserves is higher than the cost involved in finding those reserves and the opportunity cost of the value of the reserves at the beginning of the period. The opportunity value is important because the alternative for the owners of the firm could have been to sell all reserves at the beginning of the period and invest those funds elsewhere, earning a commensurate rate of return.
Incorporating all of the above, we find that the EVA calculation incorporating the reserve adjustment is as follow:
Oil & Gas Performance Measurement Study
We studied the performance of the five most important O&G integrated companies in order to understand what measure of performance is best correlated to shareholder value. We looked at various metrics over the last six years (2015–2020) and compared these to the annual TSR. The firms included in our analysis are:
- ExxonMobil Corporation
- Chevron Corporation
- Occidental Petroleum Corporation
- Royal Dutch Shell plc
- BP
The results of this study are highlighted in the following graphs:
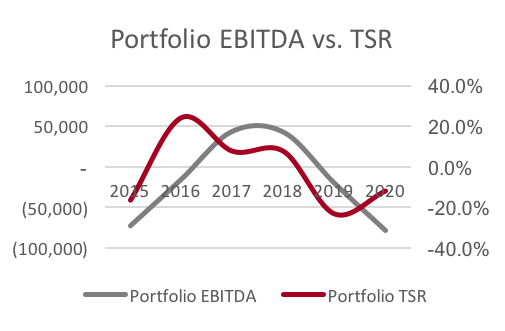
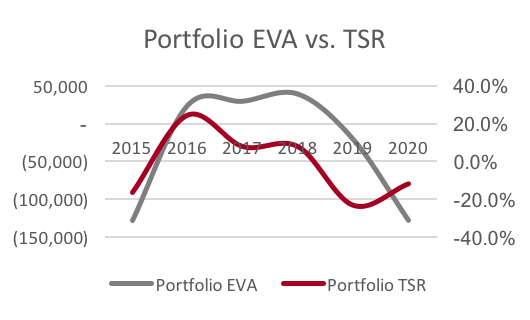
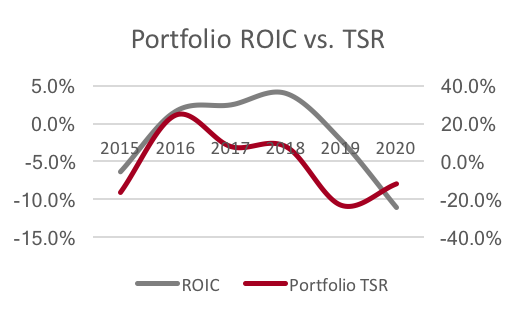
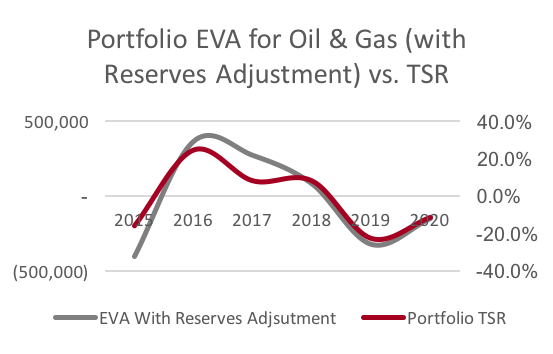
It is quickly apparent that the metric that better tracks TSR is EVA with reserve adjustment.
In addition to a visual appraisal, we looked at the correlations of the main metrics with TSR. The superiority of Oil & Gas EVA is even more remarkable:
- Correlation with Δ EBITDA: 0.081
- Correlation with Δ EVA without reserves adjustment: 0.144
- Correlation with Δ ROIC without reserves adjustment: 0.167
- Δ EVA with Reserves Adjustment: 0.490
Results are even more striking when we modify the TSR component of the analysis so that it is not only looking at the TSR on the day of the reserve disclosure, but instead takes an average of the adjusted share price for the day of disclosure and the 29 days preceding it. This allows us to dilute the impact of exogenous factors on share price movements and to reflect the possibility that some of the results disclosed may have been reflected in a firm’s share price prior to them being released to the public.
The results of this amended analysis are as follow:
- Correlation with Δ EBITDA: 0.357
- Correlation with Δ EVA without reserves adjustment: 0.453
- Correlation with Δ ROIC without reserves adjustment: 0.420
- Δ EVA with Reserves Adjustment: 0.634
Conclusions
As is clear from our analysis, it is imperative to incorporate the value of the reserves into any measure of performance of an integrated O&G firm. Any measure that fails to do so is not correctly assessing the value that E&P contributes to the firm.
Oil & Gas EVA is by far the most superior measure of performance for an integrated O&G firm.