
Performance Appraisal Versus Value-Driven Strategy: A Study of America's Oil and Gas Industry
1/21/2013
In the oil and gas industry, performance appraisal and strategy are diametrically opposed. Key indicators highlighted in annual reports include return metrics like ROACE (return on average capital employed), or production metrics, such as cost per barrel and production barrels. More recently, some show reserve replacement numbers, e.g. barrels of new reserves versus barrels produced. Yet, these key performance indicators, especially the financial ones (returns or annual profits), mask the major strategic goal of the industry: finding and developing new reserves. The short-term metrics and focus on production could cause managers to cut back on the high costs and capital expenditures needed for exploration for two reasons. First, there are long lead times from discovery to production and profit generation; second, these investments have high risk.
Luckily for shareholders, strategy usually trumps the performance appraisal process, as the mad dash to shale illustrates: the large capital invested and the research and development originally spent would have reduced returns on capital. High oil and gas prices (before the shale glut) helped. But the longer-term view aligns with the perspective of shareholders: research by the Society of Petroleum Engineers, as well as by Stern Stewart, show the highest correlation of share prices with reserve barrels or values, not production performance or annual profits.
American-based upstream (exploration and production focused) oil and gas companies had little choice but to invest in shale and other complex exploration projects (e.g. tar sands). National champions that had invited western firms to co-invest or to provide technical know-how have become more nationalistic and competent. They now share less. With the boom in prices, contracts and taxes were re-written to give the governments a greater share of wealth produced by wells operated by foreign firms. Furthermore, reserve replacement occurred in riskier places (Russia, Central Asia, Africa versus the North Sea and the Gulf of Mexico) with a significant increase in the proportion of reserves coming from natural gas versus oil. The fact that shale rock provides not only gas but also oil means that American firms can now replace oil produced abroad with domestic shale oil rather than with natural gas in barrels of oil equivalent (BoE).
From 2007 to 2011 (2012 data were not available), the 30 largest American-based upstream (exploration and production) firms had their largest capital expenditures, especially in 2010-2011. Of this increase, approximately 50% was in development and 50% was in exploration and property acquisition. Costs have risen too. Most – if not all – players globally have shortages of labour and equipment, while the industry increases its supply of petroleum products after 9 years of higher than historically average prices.
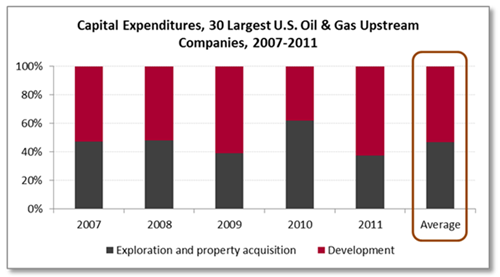
Figure 1. Capital expenditures - 30 largest U.S. O&G upstream companies
For these upstream players, the investment has increased oil reserves by 2.4% per year and gas reserves by 4.1% per year. Their oil and gas reserves fell in Europe and Africa but rose in North America, especially in natural gas (up 36%). As a result, their natural gas reserves have become more American (from 67% to 71% of the total). In Asia/Middle East, oil reserves were maintained while gas reserves increased. This geographical change may reduce their cost of capital since political risk may have fallen – “may” because their reserves in “other” unspecified regions have also risen, particularly in oil.
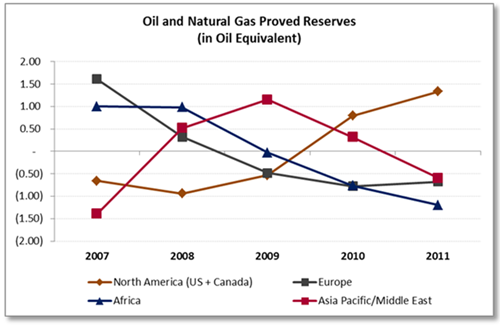
Figure 2. Oil and natural gas proved reserve
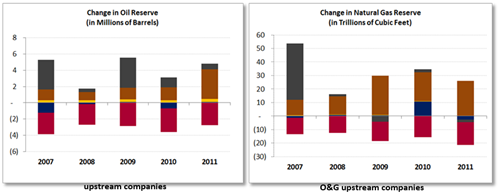
Finally, what is responsible for the change in reserves? The greatest change in oil reserves comes from a category called revisions: where producers have changed their production estimates from their existing properties due to price, cost, or technology. The second largest change in oil reserves comes from exploration. During other periods, American oil and gas firms and their global peers dressed up their reserve replacement with purchases, but from 2007 to 2011, the 30 studied sold more than they bought. The greatest change in natural gas reserves comes from exploration, but firms also enhanced their numbers through revisions, improved recovery, and purchases.

The numbers show that the firms are taking the right strategic action despite the return and production metrics on which their performance appraisals are based. These firms are not only consistently producing – they are executing on value-driven strategy that focuses on spending on the right reserve replacement and enhancement, e.g. greater organic rather than acquired growth. Continued spending on reserve replacement should lead to greater production of gas and oil in North America which corroborates the recent prediction of the International Energy Agency’s report on America’s expected boom in energy supplies: that America will transform from an importer to a self-sufficient producer and possibly exporter of petroleum products.