
US vs. Chinese Companies Revenues or Value Creation?
11/20/2020
As a result of the important growth within China’s economy, in the last decade many Chinese companies have entered the Fortune 500. In fact, the latest report has shown that Chinese companies now outnumber US firms in the Fortune 500. As a result, many analysts have concluded that now China’s corporate performance outperforms that of the United States. Despite this impressive feat on the part of Chinese companies, the picture looks slightly different when we look at wealth created for shareholders.
A superficial reading that looks primarily at the number of Chinese corporations within the Fortune 500 can be misleading in terms of financial performance, as the ranking methodology considers only the magnitude of a corporation’s revenues. Such an analysis does not consider either the magnitude of market capitalization or any other robust indicator of value creation.
To better understand shareholder wealth creation and contrast with the revenue-based Fortune 500, we analyzed the world’s top five hundred (by market capitalization) public corporations using value metrics. Our findings show that American firms outperform Chinese ones in terms of both market capitalization and value creation as measured by Market Value Added (MVA).
In terms of market cap, 38.8% of the world’s top five hundred firms are American versus a much lower 13.2% for China. In addition, 52.6% of the aggregate market cap of the top five hundred world companies comes from US firms vs. 11.2% for Chinese companies. Further demonstrating the strong performance of US companies, the average market cap of US companies among the world’s top five hundred firms is $114.346 billion vs $71.841 billion for China (a 37.2% disparity).
MVA is a metric that identifies how much value is created for shareholders on top of the capital contributed to the firm, similar to looking at the difference between the market and book value of a firm. In terms of MVA, US firms in our analysis made up, in aggregate, 64.3% of the MVA of the world’s top five hundred companies, in contrast to an aggregate 7.2% by Chinese firms. Average MVA for US companies were three times higher than those for Chinese companies.
Furthermore, there are fourteen US firms in the world’s top twenty value creators as measured by MVA. These fourteen firms have created an average of $7.1 trillion in wealth for shareholders over the last five years, higher than the $1.7 trillion created by all sixty-six Chinese firms in the world’s top five hundred companies combined:
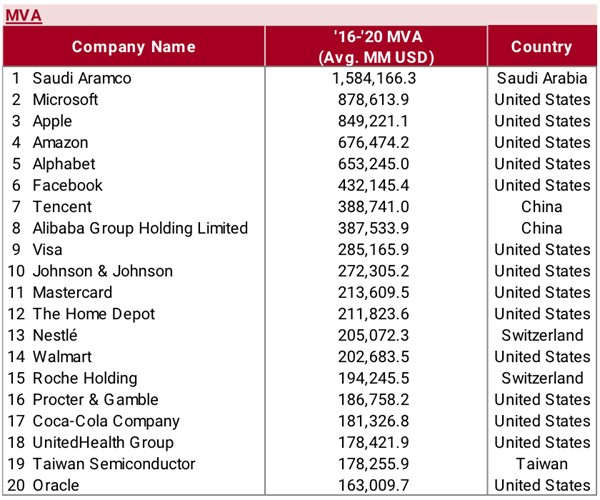
Top 20 World Companies in 5-year (2016-2020) value creation, as measured by MVA.
A few things explain the superiority of American firms in creating shareholder value. The main one is the difference in the expected rate of return for investors, also known as the cost of capital. The cost of capital for Chinese firms is higher as investors take into account the higher risk of investing in Chinese equities. Investors are weary of the lack of progress in the realm of corporate governance within Chinese firms, as highlighted, for example, by their continued opaque shareholding structures. Furthermore, Chinese firms’ accounting and financial scandals (e.g., Luckin Coffee as one of the most recent ones) significantly impact shareholders’ capital allocation decisions. While such scandals are not exclusive to Chinese companies, as Germany’s Wirecard has shown, they are still more frequent in China, and investors worry that similar types of misconduct continue undetected and unpunished.
Investors ask themselves, why invest in high-risk Chinese companies when US companies prove a safer alternative, especially since one can invest in US companies and yet still have exposure to the Chinese market through these equities? By allocating capital to US firms with Chinese exposure, investors can still include China in their investment strategy without having to invest directly in Chinese equities and take on those risks.
It is also very important to highlight that while over the last year most of the S&P 500 gains have been led by tech firms, eight of the fourteen US firms in the world’s top twenty by market cap are not tech firms. This shows that sustainable shareholder value can be created by firms across various sectors, not only within the tech sector.
In conclusion, China’s skyrocketing economic growth has led to the inclusion of 133 companies in 2020’s Fortune 500, an amazing improvement since in 1990 there were no Chinese companies at all in the top five hundred ranking. However, as the Fortune 500 ranking measures revenues, its rankings can be misleading in terms of value creation for shareholders. When looking at better indicators such as market cap and MVA, US companies still highly outperform Chinese companies, even beyond the tech sector.
Note: The data provided is current as of 3Q 2020.